
Data Analytics
Structured analysis of sales, customers, operations and finance so patterns are visible and useful.
- Trend and KPI analysis
- Performance diagnostics
- Opportunity identification
Speak with the team
Data analytics consulting
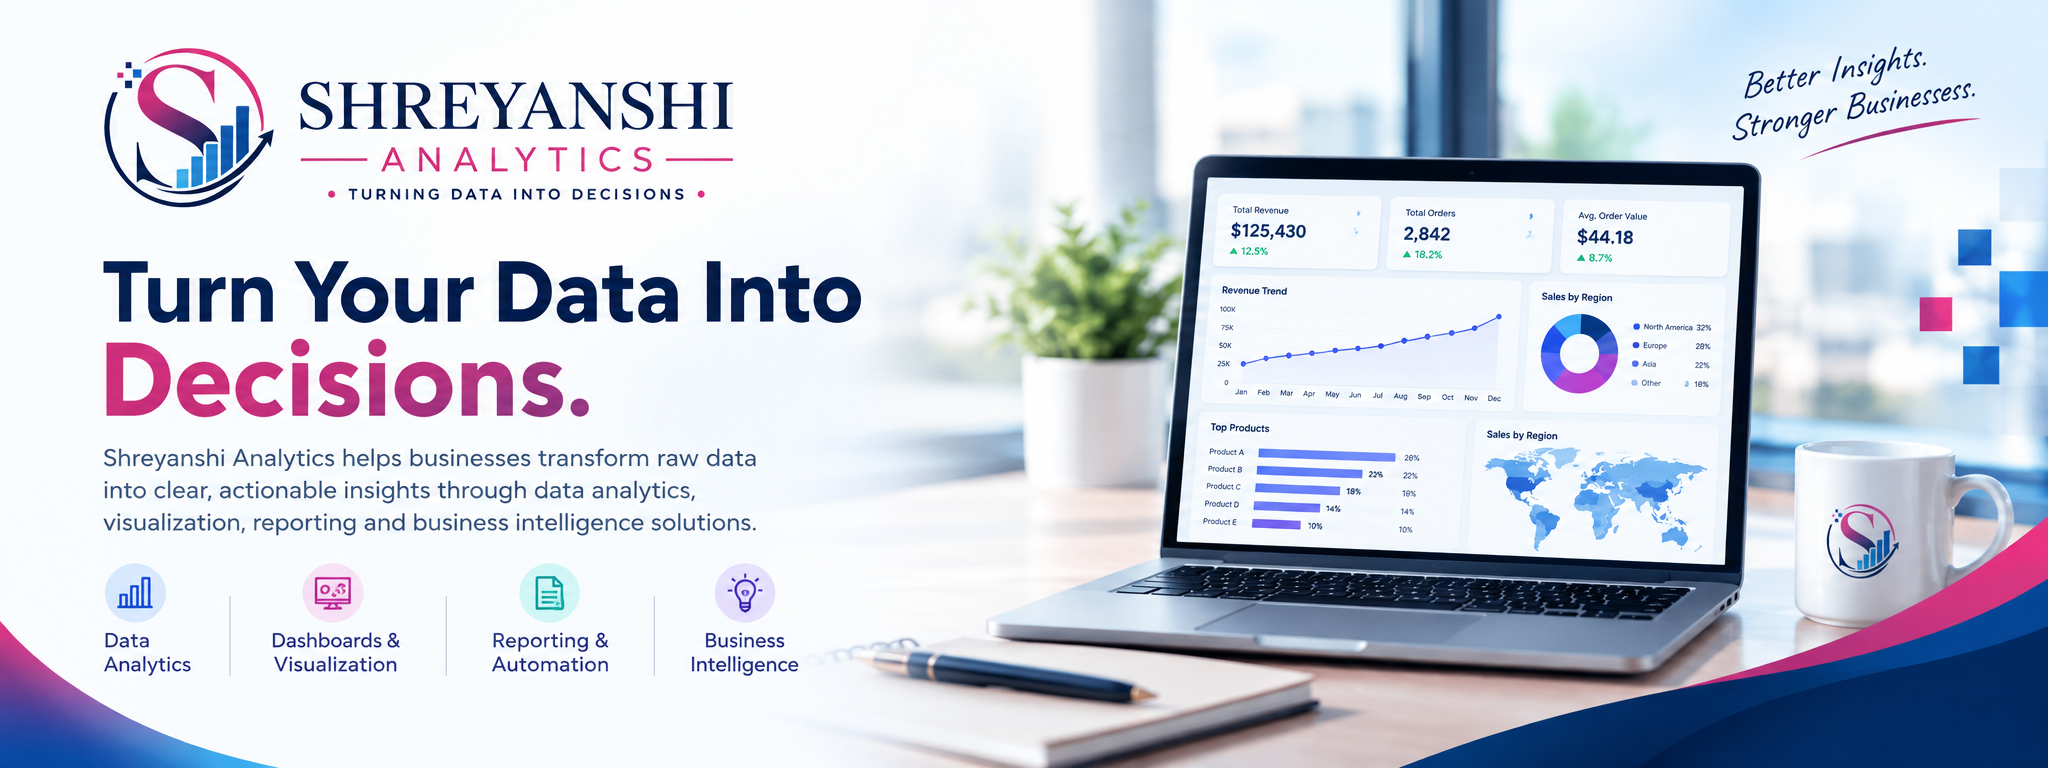
Shreyanshi Analytics helps businesses transform raw data into clear, actionable insight through analytics, Power BI dashboards, Excel, SQL, visualization, reporting and business intelligence.
About
Shreyanshi Analytics is a data analytics practice built to help teams see what is happening, why it matters, and what to do next. The work sits between raw data and the decisions leaders actually need to make.
We design dashboards, reports and analysis around your questions—not around a generic template. Whether the source is a spreadsheet, a SQL database or a mix of both, the goal is the same: clarity you can act on.
Every chart and KPI is tied to a decision, a process or a performance question.
Solutions are built in Power BI, Excel and SQL so teams can own and maintain them.
Trends, patterns and KPIs explained in business language.
Interactive views of the metrics that matter each week.
Repeatable reporting that reduces manual spreadsheet work.
From scattered files to a shared picture of performance.
Services
Engage a single service or combine them into an end-to-end analytics engagement.
Structured analysis of sales, customers, operations and finance so patterns are visible and useful.
A practical BI layer that connects data sources to the questions leadership asks every month.
Interactive Power BI dashboards for sales, finance, HR, marketing and operations teams.
Robust Excel models, pivot analysis and management-ready workbooks teams can run themselves.
Reliable queries and transformations so dashboards and reports sit on clean, consistent data.
Charts and layouts designed so a busy reader can understand the story in seconds, not slides.
Monthly packs, KPI summaries and workflows that reduce copy-paste reporting.
Bespoke KPIs, ad-hoc analysis and decision support shaped around a specific business question.
Analytics process
A clear path from the business problem to a dashboard, report or recommendation you can use.
Define the decision, the audience and the question the data must answer.
Identify the right sources in Excel, SQL, Power BI or existing files.
Clean, model and explore the data until the story is reliable.
Build dashboards and reports that leaders can read at a glance.
Translate findings into next steps, not just another chart pack.
Portfolio
These are sample / demo dashboard concepts, not client case studies. They illustrate the kinds of views Shreyanshi Analytics can design. Live project work can replace them when it is ready to share.
Sample / Demo
A Power BI-style view of revenue, orders, products, regions and monthly movement—built to show how sales performance can be monitored in one place.
Sample / Demo
Workforce composition, attrition signals, department views and hiring trends presented so people teams can brief leadership with confidence.
Sample / Demo
Channel, campaign and conversion reporting designed to show where attention and spend are actually producing results.
Sample / Demo
Revenue, expense, margin and budget-versus-actual layouts for finance reviews—clear enough for a board pack, detailed enough for analysis.
Why choose us
The aim is not more charts. It is a cleaner line from data to the next useful action.
Start a ConversationAnalysis is framed around performance, risk and opportunity—not around the tool for its own sake.
Complex data is translated into reports and visuals a non-technical stakeholder can use.
KPIs, grain and layout follow your process, your data and your reporting cadence.
Each engagement is designed to leave you with something you can run, share and decide from.
Next step
Share the question you need answered. We will help you shape a practical analytics approach.
Contact
Share what you want to understand, improve or automate. We will help you identify a practical analytics approach.